In this article we’ll explore together how to integrate charts into Xamarin Forms Application. It has always been very important to display chats for a mobile user in order to provide users with a clear overview of digital data.
In this tutorial, we’ll use Microcharts Nuget plugin. It is just simple drawing on top of the awesome SkiaSharp library. The purpose is not to have an heavily customizable charting library. If you want so, simply fork the code, since all of this is fairly simple. Their is no interaction, nor animation at the moment.
Note that this framework does not support the display of multiple data. If for example you want to display the line Chart with 2 lines, you will have to override the DrawContent method of the LineChart class.
You can get the code from GitHub.
LineChart
Let’s begin by creating a new project called Charts, in which we install the NuGet package “Microcharts.Forms” and “Microcharts“

Data Entries
Displaying charts in general need which called series. It’s a structure combine data to show and label signification. The data value will be shown at the top of chart and it’s label at the x-axis at the buttom. This series called in Microcharts ChartEntry. it has always the same structure regardless of the chart type that you want to use:
- Floating number representing its value.
- Label describing what your entry is associated with.
- ValueLabel to format your value.
- Color associated with the entry.
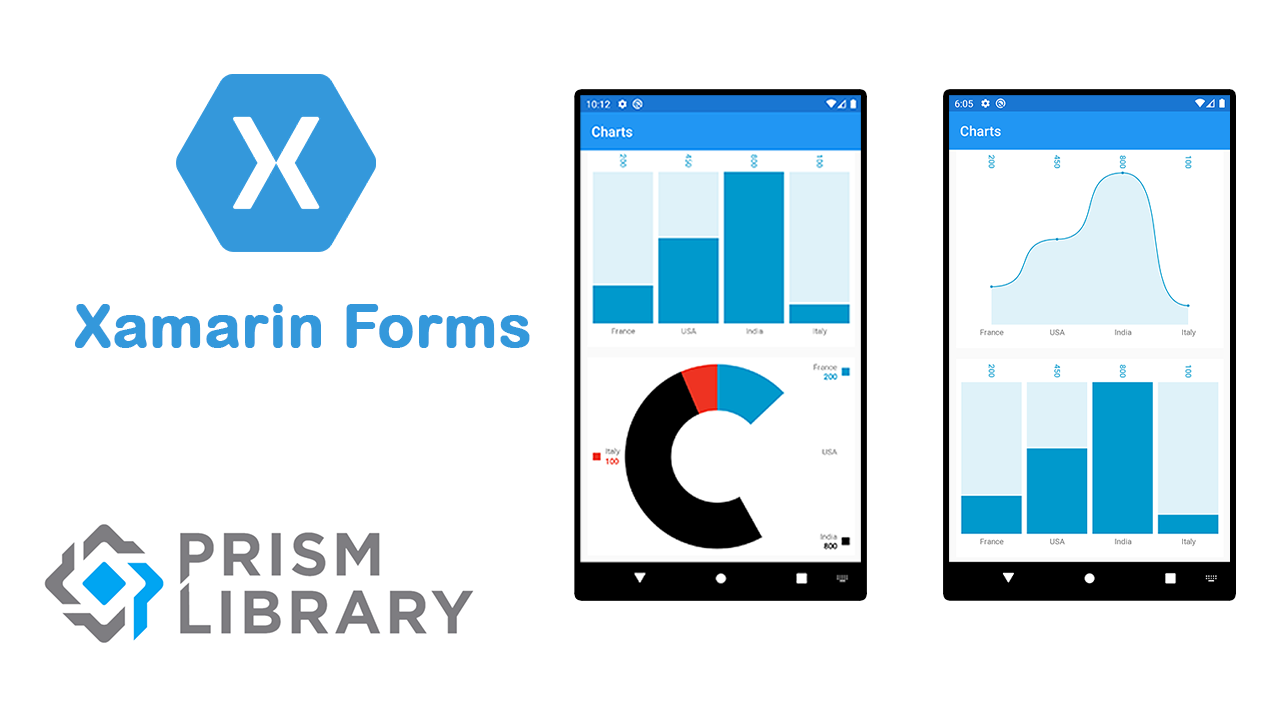
Image that we want to show the number of web site visitor by country, so your entry will look like:
using Prism.Navigation;
using System.Collections.Generic;
using SkiaSharp;
using Microcharts;

namespace Charts.ViewModels
{
    public class MainPageViewModel : ViewModelBase
    {
        private LineChart lineChart;
        public LineChart LineChart
        {
            get => lineChart;
            set => SetProperty(ref lineChart, value);
        }
        public MainPageViewModel(INavigationService navigationService)
            : base(navigationService)
        {
            Title = "Charts";
        }

        public override void OnNavigatedTo(INavigationParameters parameters)
        {
            base.OnNavigatedTo(parameters);
            InitData();
        }

        private void InitData()
        {
            var blueColor = SKColor.Parse("#09C");
            var chartEntries = new List<ChartEntry>
            {
                new ChartEntry(200)
                {
                    Label = "France",
                    ValueLabel = "200",
                    Color = blueColor
                },
                new ChartEntry(450)
                {
                    Label = "USA",
                    ValueLabel = "450",
                    Color = blueColor
                },
                new ChartEntry(800)
                {
                    Label = "India",
                    ValueLabel = "800",
                    Color = blueColor
                },
                new ChartEntry(100)
                {
                    Label = "Italy",
                    ValueLabel = "100",
                    Color = blueColor
                },
            };

           LineChart = new LineChart { Entries = chartEntries, LabelTextSize = 30f, LabelOrientation = Orientation.Horizontal };
        }
    }
}
Obviously, we can change the label seize and orientation using the LabelTextSize and LabelOrientation.
In the Xaml code, just add the reference to Microcharts and use the ChartView Tag.
<?xml version="1.0" encoding="utf-8" ?>
<ContentPage xmlns="http://xamarin.com/schemas/2014/forms"
             xmlns:x="http://schemas.microsoft.com/winfx/2009/xaml"
             xmlns:microcharts="clr-namespace:Microcharts.Forms;assembly=Microcharts.Forms"
             x:Class="Charts.Views.MainPage"
             Title="{Binding Title}">
<Grid>

        <microcharts:ChartView Margin="10,0,10,10"
                     Chart="{Binding LineChart}"
                     HeightRequest="300"
                     VerticalOptions="Start"
                     HorizontalOptions="Fill"/>


    </Grid>
</ContentPage>

BarChart
This chart follows the same data structure format. To display a BarChart just add a new property called BarChart and bind it to a new ChartView tag in the Xaml code. So it seems like this code:
   private BarChart barChart;
   public BarChart BarChart
   {
         get => barChart;
         set => SetProperty(ref barChart, value);
   }
Inside the Initdata method, add the initialization of this property:
BarChart = new BarChart { Entries = chartEntries, LabelTextSize = 30f, LabelOrientation = Orientation.Horizontal };

DonutChart
For this type of chart, specifying the color for each data is important to distinguish the difference between them. Otherwise, you will have one block with the same color.
That’s why, add a new list of ChartEntry with unique color for each item.
 var chartEntriesDonut = new List<ChartEntry>
 {
       new ChartEntry(200)
       {
           Label = "France",
           ValueLabel = "200",
           Color = blueColor
       },
       new ChartEntry(450)
       {
           Label = "USA",
           ValueLabel = "450",
           Color = SKColor.Parse("#FFF")
        },
         new ChartEntry(800)
         {
             Label = "India",
             ValueLabel = "800",
             Color = SKColor.Parse("#000")
         },
         new ChartEntry(100)
         {
             Label = "Italy",
             ValueLabel = "100",
             Color = SKColor.Parse("#E32")
         },
   };

DonutChart = new DonutChart { Entries = chartEntriesDonut, LabelTextSize = 30f };
In the Xaml code Add new ChartView tag and bind it to DonutChart.
Don’t forget to put the hole Grid inside a ScrollView component.
<?xml version="1.0" encoding="utf-8" ?>
<ContentPage xmlns="http://xamarin.com/schemas/2014/forms"
             xmlns:x="http://schemas.microsoft.com/winfx/2009/xaml"
             xmlns:microcharts="clr-namespace:Microcharts.Forms;assembly=Microcharts.Forms"
             x:Class="Charts.Views.MainPage"
             Title="{Binding Title}">

    <ScrollView>

    <Grid>
        <Grid.RowDefinitions>
            <RowDefinition Height="300"/>
            <RowDefinition Height="300"/>
            <RowDefinition Height="300"/>
        </Grid.RowDefinitions>
        <microcharts:ChartView Margin="10,0,10,10"
                     Chart="{Binding LineChart}"
                     HeightRequest="300"
                     VerticalOptions="Start"
                     HorizontalOptions="Fill"/>

        <microcharts:ChartView
                     Grid.Row="1"
                     Margin="10,0,10,10"
                     Chart="{Binding BarChart}"
                     HeightRequest="300"
                     VerticalOptions="Start"
                     HorizontalOptions="Fill"/>

        <microcharts:ChartView
                     Grid.Row="2"
                     Margin="10,0,10,10"
                     Chart="{Binding DonutChart}"
                     HeightRequest="300"
                     VerticalOptions="Start"
                     HorizontalOptions="Fill"/>
    </Grid>
    </ScrollView>
</ContentPage>
Run the application and you will see the 3 charts:


Follow Me For Updates
Subscribe to my YouTube channel or follow me on Twitter or GitHub to be notified when I post new content.
There is definately a great deal to know about this subject. I like all the points you have made.
I have tried the Multiline Chart and encounter problem of the program.
Particularly , how to get the ViewModelBase program?
Do you have a complete source code that I can use it?
any charges for the complete source code for the Multilinechart program?
You can email to me.
thanks
Hello Tony,
You can check the code source on GitHub
Thanks